India’s Troubled Relationship Between Capex, Infra-Growth and Employment Creation

India’s infrastructure push did not fail because investment was insufficient, but because it was structurally disconnected from labour-market realities.
As the presentation of the Union Budget 2026 remains a week away, the state of the Indian economy, amidst a larger government push to fiscally prioritise capital expenditure, and crowd-in private investment for an infra-driven growth has failed to uplift vital expectations around jobs and better employment-linked industrial growth.
In pushing for infrastructure growth expansion, the Union government’s capital-expenditure volume surged 40% year-on-year in the first half of FY26, as total capex utilisation reached Rs 6.6 trillion. The Union government is now planning to further increase this investment by 7% in the upcoming budget to around Rs 12 trillion, signalling a continued belief in and commitment to infrastructure driven growth.
The government confronts a core concern for a decade of sustained capex increases – driven at the cost of revenue expenditure and welfare needs – that should have ensured greater job creation but rather delivered joblessness. As youth unemployment stands at approximately 14% for those aged 15–29, nearly three times national average of roughly 5%. Labour force participation remains ‘structurally weak’ despite Rs 11.21 trillion committed to capex.
Source: Government of India, Ministry of Finance. Union Budget at a Glance, 2015–16 to 2025–26.
The capex stragey and the crowding-in illusion
India’s public investment push over the past decade has been premised on a simple causal chain: more public capex would create infrastructure, infrastructure would attract private investment, and private investment would create jobs. Yet the empirical record suggests a far more uneven reality.
Public capex has expanded rapidly, with roads and railways comprising the largest share of the centre’s capex at 62.8%. The Ministry of Road Transport and Highways utilised 63% of its FY26 budget by September 2025, while railways achieved 57%, both outpacing the national 52% utilisation rate.
RBI’s real sector data indicates that new private projects in textiles, food processing, apparel, and leather declined as a share of total announcements between FY18 and FY25, even as overall project costs rose to Rs 2.67 trillion in FY26, driven mainly through renewables, power, and data infrastructure.
A critical nuance is the time lag in the crowding-in process. Freight corridors, expressways, and logistics hubs typically take several years to have their wider economic effects assessed. As of 2024–25, most sections of the Eastern and Western Dedicated Freight Corridors are operational.
Yet, official evaluations focus on reductions in freight time and logistics costs rather than on documented industrial relocation or employment gains. This indicates that improved connectivity alone has not yet translated into observable labour-intensive investment, and that factors such as land costs, availability of worker housing, regulatory certainty and skill readiness remain more decisive than transport upgrades in shaping private location decisions.
Source: NITI Aayog’s India’s Service Sector Report (2025)
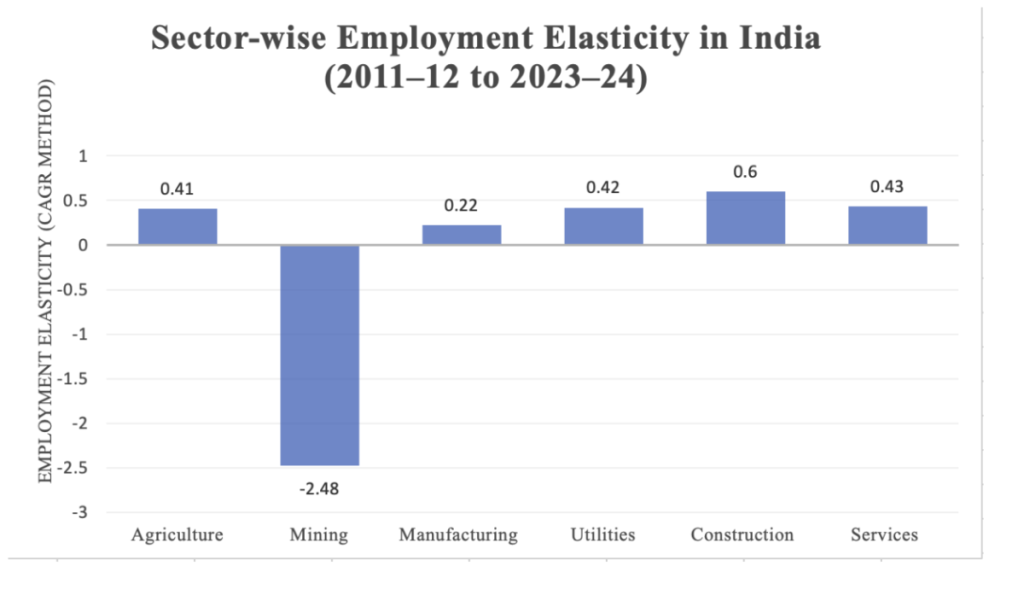
Employment elasticity patterns, which measure how much employment changes in response to a change in economic activity (driven by GDP growth), reinforce this structural misalignment.
Over 2011-2024, construction (0.60) and services (0.43) were the only sectors consistently absorbing labour, while manufacturing registered 0.22 and mining fell to –2.48.
High construction elasticity reflects growth in low-productivity manual work, not a transition to higher-quality jobs. Low manufacturing elasticity indicates that India is substituting high-quality employment potential with low-quality absorption, which contradicts the stated goal of a high-income transformation.
Labour-intensive sectors that should have benefited from infrastructure expansion still lack access to credit, cluster depth, power reliability, and vocational pipelines.
These weaknesses prevent labour-intensive industries from scaling even in regions where infrastructure quality has improved.
Infrastructure Scores and Unemployment Rates Across Indian States, FY 2019–20
| Higher GSDP Group | Lower GSDP Group | ||||
|---|---|---|---|---|---|
| State | Infrastructure Score | Unemployment Rate (%) | State | Infrastructure Score | Unemployment Rate (%) |
| Himachal Pradesh | 1.79 | 13.0 | Assam | 0.95 | 27.5 |
| Tamil Nadu | 1.65 | 20.9 | Odisha | 0.93 | 19.6 |
| Kerala | 1.54 | 35.4 | Uttar Pradesh | 0.91 | 12.6 |
| Gujarat | 1.51 | 5.8 | Madhya Pradesh | 0.92 | 8.4 |
| Karnataka | 1.46 | 14.1 | Bihar | 0.70 | 17.6 |
| Haryana | 1.29 | 17.6 | Jharkhand | 0.61 | 11.6 |
As a result, while the state built assets, private capital consolidated in capital-intensive sectors misaligned with India’s labour surplus, indicating that India’s investment boom has increased the economy’s capital intensity rather than its labour intensity, reinforcing transformation in the wrong direction. This misalignment between where capital flows and where labour exists sets the stage for the employment paradox that follows.
Infrastructure scores are composite indices constructed from physical and logistics indicators (transport, power, and connectivity) and are presented contemporaneously for FY 2019–20 to illustrate cross-state variation rather than establish causal effects.
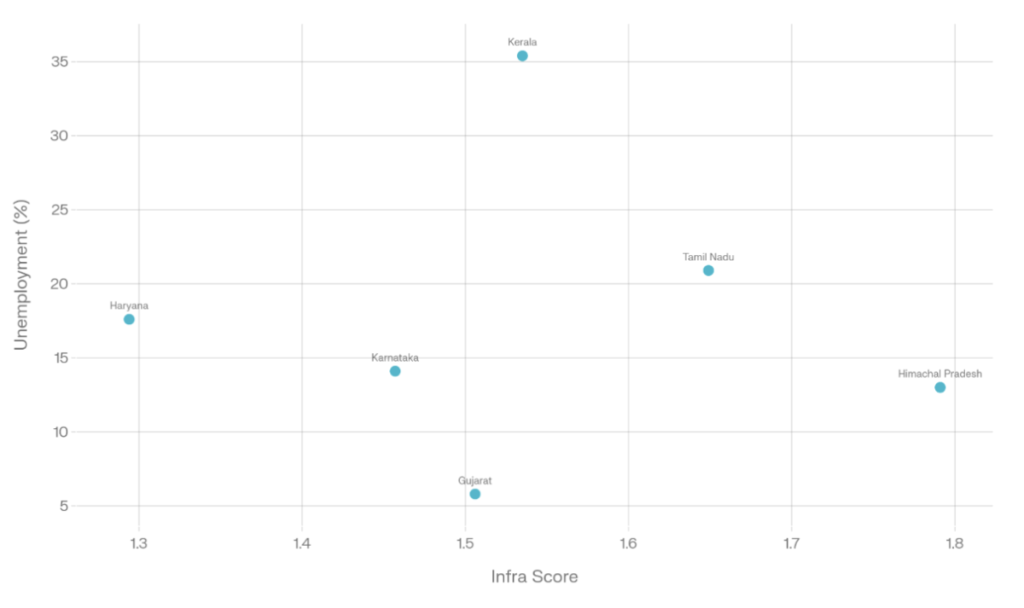
Infrastructure versus Unemployment – Higher Per Capita GSDP States, FY 2019–20
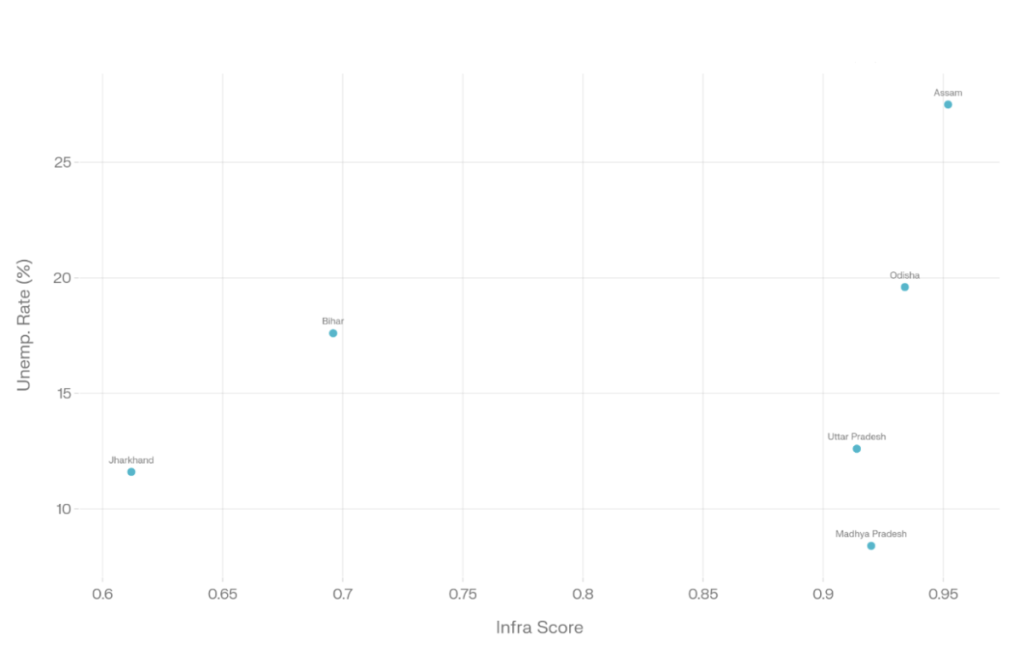
Infrastructure versus Unemployment – Lower Per Capita GSDP States, FY 2019–20
Sources: World Bank Group, Development Economics, Development Research Group, Ministry of Statistics and Programme Implementation (MOSPI), Government of India, Ministry of Statistics and Programme Implementation (MOSPI), Government of India.
At the state level, infrastructure indicators show no consistent relationship with unemployment outcomes in FY 2019–20. Across 12 states, infrastructure scores (0.61–1.79) are paired with unemployment rates (5.8%–35.4%) without a linear pattern in either GSDP group.
Gujarat and Madhya Pradesh achieve low unemployment (5.8%, 8.4%) despite modest infrastructure, while Kerala and Assam show elevated joblessness (35.4%, 27.5%) despite stronger scores.
This state-level heterogeneity, mirroring the sectoral elasticity patterns above, demonstrates that infrastructure expansion alone neither guarantees nor precludes employment absorption. Connectivity improvements are necessary but insufficient without complementary policies on sectoral composition, labour-intensive investment, and institutional enablers.
This pattern reinforces a central finding that infrastructure-led strategies have operated in isolation from the quality, sectoral composition, and labour intensity of the growth they enable. Infrastructure may reduce transaction costs and increase market access.
Still, it does not determine whether firms will locate in labour-intensive sectors, offer stable formal employment, or invest in human capital deepening. Where infrastructure has expanded without corresponding shifts in sectoral policy, credit access for labour-intensive industries, and skill-readiness frameworks, the gains have accrued to capital-intensive and non-tradeable sectors, leaving large segments of the labour force disconnected.
The job-creation paradox
The relationship between employment and Gross Value Added (GVA) reveals the clearest break in India’s labour market. Between 2012 and 2019, GVA grew at 6.7% while employment growth fell to almost zero. The post-2020 recovery reflects distress-driven re-entry rather than productive hiring. With output expanding without labour absorption, workers were pushed into construction and low-productivity services where work is informal, variable and insecure.
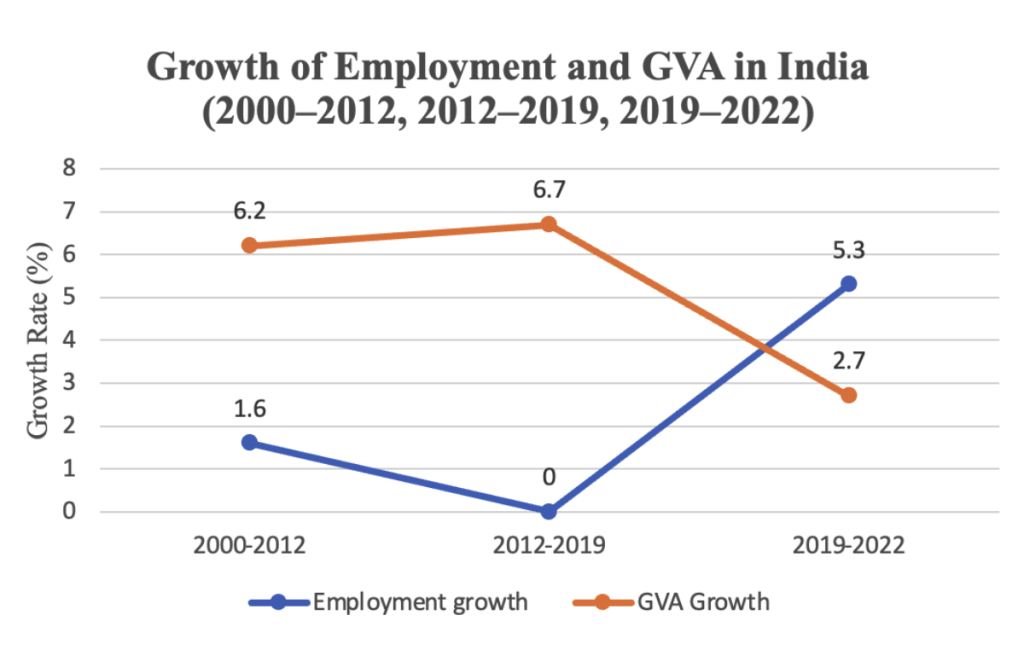
Source: International Labour Organisation (ILO), India Employment Report 2024: Youth Employment, Education and Skills
H1 FY26 investment patterns show why. Of Rs 15.1 trillion in project announcements, 57% went to capital-intensive manufacturing and 22% to electricity.
Labour-absorbing sectors attracted marginal shares. Completions show an even sharper skew, with 61% of the Rs 4 trillion in completed projects coming from transport services, a sector with limited job multipliers.
The resulting employment is overwhelmingly casual, self-employed or gig-based. Cases such as 992 PhDs, 23,000 MPhil holders and over 50,000 graduates applying for Class-10-level posts in Tamil Nadu and Uttar Pradesh reveal a structural pattern of educated underemployment.
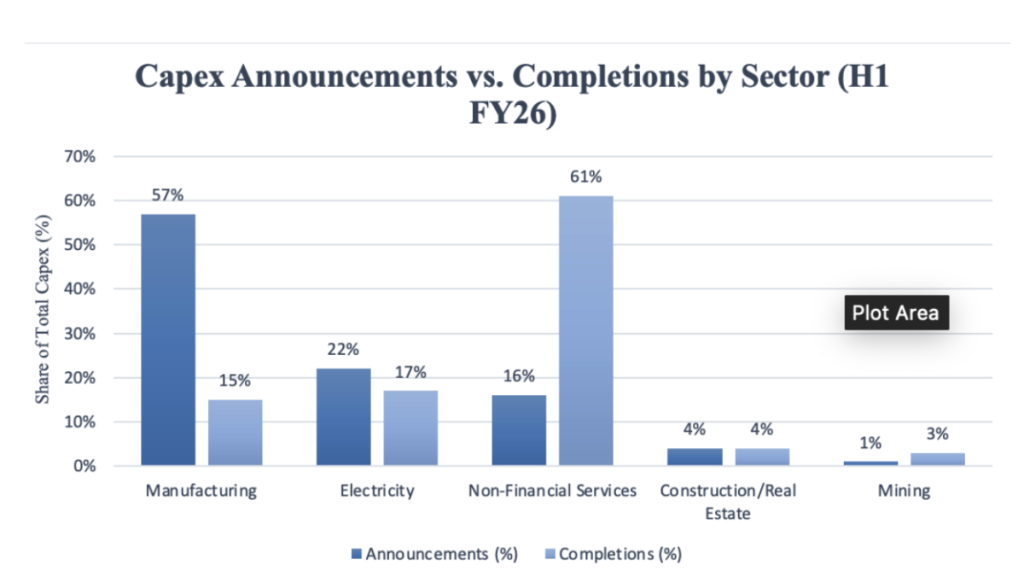
Source: CMIE Economic Outlook and CareEdge Ratings, H1 FY26 Capex Data
Gig work has become the default absorber. India’s gig workforce stood at 77 lakh in 2020-21 and is projected by NITI Aayog to reach 23.5 million by 2029-30, with platforms such as Zomato, Swiggy, Ola, Uber, Dunzo and Urban Company absorbing a growing share of displaced labour.
Yet ILO 2024 finds that platform earnings decline over time due to piece-rate cuts and unpaid waiting, forcing 60-70-hour workweeks. Gig work thus mirrors the broader capex-driven shift toward capital-intensive production, as it absorbs the labour that formal manufacturing no longer attracts, functioning as the informal counterpart to an increasingly capital-deep economy.
Underlying these patterns are constraints on rural–urban mobility. In 2023–24, services accounted for 60.8% of urban employment but only 18.9% of rural jobs, while agriculture still absorbed 59.8% of rural workers. Infrastructure reduced physical distance yet did little to ease the economic and institutional barriers that shape migration decisions.
The 2025 Viksit Bharat – Guarantee for Rozgar and Ajeevika Mission (Gramin) Act, which replaces MGNREGA, shifts the programme from a demand-driven legal guarantee to a budgeted, norm-based framework. This weakens the rural safety net that historically delivered 45–55 days of work per household and relied on statutory enforceability, particularly for women who consistently account for over 55% of total person-days.
Urban labour markets, meanwhile, lack affordable housing, social protection and stable manufacturing jobs. The result is a pattern of circular and temporary migration rather than stable relocation, leaving highways underutilised as labour channels and keeping urban labour markets too thin to benefit from infrastructure-led growth.
Fiscal trade offs: Capex versus social spending
India’s capex-first strategy did not falter simply because social spending was low; it faltered because the fiscal architecture made any rebalancing toward labour-augmenting investments structurally impossible.
Budget 2025–26 allocates Rs 11.21 trillion to capital expenditure, up 10.1%, while revenue expenditure for health, education and skills rises only 6.7%. Hard constraints shape this divergence. Interest payments have climbed to Rs. 12.76 trillion, absorbing 25.2% of total expenditure and 37% of net revenue receipts.
Once interest and deficit targets are fixed, revenue expenditure becomes the only adjustment lever. This is why key welfare schemes remain effectively stagnant: MGNREGA stays frozen at Rs 86,000 crore and PM-KISAN remains at Rs 63,500 crore, identical to last year’s revised estimates, despite worsening rural underemployment.
The Union Budget shows that human capital spending remains modest relative to the scale of capex. In 2025-26, the Ministry of Education receives Rs 1.28 lakh crore and the Ministry of Health Rs 99,859 crore, while flagship schemes such as Samagra Shiksha (Rs.41,250 crore) and the National Health Mission (Rs 37,227 crore) grow only marginally.
The constraints sharpen at the state level. States finance most health, education and skills delivery, so shrinking untied revenues directly weakens job creation. Yet their fiscal room is tightening. Gross tax revenues are expected to grow 10.8% in FY26. Still, devolution to states rises only 10.5% because an increasing share of central taxes flows through cesses and surcharges that do not enter the divisible pool.
This cess heavy financing model squeezes states’ untied revenues, limiting their ability to invest in skills training and other labour-augmenting areas. A rebalancing mechanism, such as a Job-Linked Capex Incentive scheme that provides states with additional matched funding for capital projects demonstrably linked to employment generation in labour-intensive sectors, or reforms to the 16th Finance Commission’s grant criteria to reward states that achieve higher labour-intensive GSDP growth, could restore fiscal space for such investments.
When untied revenues shrink, states cannot build the labour-absorbing capabilities that capex-led growth requires. This means fewer resources for skills training, urban employment programmes, MSME support and public health systems that determine whether workers can move into productive jobs rather than informal fallback work.
India’s infrastructure push did not fail because investment was insufficient, but because it was structurally disconnected from labour-market realities. Capex expanded faster than the economy’s capacity to absorb workers, private investment flowed into capital-intensive sectors, and fiscal rules constrained the very social and skill investments required to close this gap. The result was growth without jobs and infrastructure without inclusion. Budget 2026 represents a critical juncture: without rebalancing toward labour-augmenting spending and restoring state fiscal capacity, India risks entrenching a development path where productivity rises while employment stagnates.
Deepanshu Mohan is Professor of Economics and Dean, O.P. Jindal Global University. He is a Visiting Professor at the London School of Economics and an Academic Research Fellow, AMES, University of Oxford.
Saksham Raj and Aditi Lazarus are students at O.P. Jindal Global University and research analysts with CNES.
Nagappan Arun contributed to the article.
This article went live on January twenty-third, two thousand twenty six, at twelve minutes past six in the evening.
The Wire is now on WhatsApp. Follow our channel for sharp analysis and opinions on the latest developments.